b = loadImage("DSC05842.JPG");
image(b, 0, 0, width, height);
filter(THRESHOLD, 0.4);

loadPixels();
for (int i = 0; i < width * height - 1; i++) {
if (pixels[i] != pixels[i + 1]){
bordo[i] = 1;
}else{
bordo[i] = 0;
}
}
updatePixels();
E’ importante capire come Processing tratta le informazioni contenute nel file: attraverso l’istruzione loadPixels(), i dati relativi ai pixel dell’immagine vengono caricati nell’array Pixels[], i cui elementi contengono il valore del colore di ogni singolo pixel.
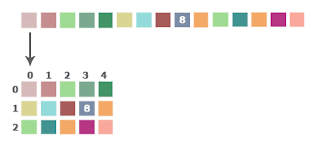
L’immagine viene “affettata”, nel senso della larghezza, in linee spesse 1px, quindi tutte le linee vengono poste una dietro l’altra, a formarne una unica. Se, ad esempio, avessimo un’immagine composta da 5×3 pixel, questa verrebbe trattata così:
Adesso vogliamo semplificare il vettore in modo da avere degli “1” lungo i bordi e “0” in tutto gli altri punti. Per farlo scansioniamo il vettore Pixels[] attraverso un ciclio “for” e, quando troviamo due valori diversi per due pixel consecutivi, cosa che indica la presenza del bordo, memorizziamo nell’elemento corrispondente dell’array bordo[] il valore “1”, mentre nell’altro caso, quando i due valori sono uguali, memorizziamo “0”. Chiudiamo questo blocco con updatePixels(), consigliato anche se non strettamente necessario.
c = loadImage("DSC05842.JPG");
image(c, 0, 0, width, height);
loadPixels();
for (int i = 0; i < width * height - 1; i++) {
if (bordo[i] == 1){
x = i%width;
y = i/width;
stroke(pixels[i]);
beginShape();
vertex(x, y); // first point
bezierVertex( x + random(25), y + random(25), x + random(25), y + random(25), x + random(25), y + random(25));
endShape();
}
}
Ora conosciamo dove sono i bordi ma non abbiamo più i valori relativi ai colori di questi bordi, avendo applicato la funzione “filter(THRESHOLD, 0.4)”.
Per questo carichiamo di nuovo la stessa immagine una seconda volta. Ora scansioniamo contemporaneamente gli array bordo[] e Pixels[] con un ciclo “for”. Quando siamo sul bordo, prendiamo il colore del pixel corrispondente e ci tracciamo una curva attraverso la funzione “bezierVertex”, assegnando dei valori random ai parametri che essa richiede, in modo da disegnare delle piccole curve. Ovviamente si può giocare con questi parametri per cambiare l’effetto risultante.
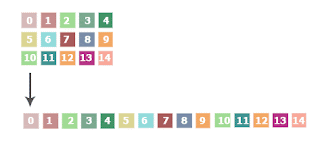
Il punto di partenza della curva sarà lungo il bordo e dobbiamo ricavare le sue coordinate, cioè dobbiamo fare il passaggio inverso a quello della figura qui sopra.
Come al solito, il punto origine del piano (0, 0) si trova nell’angolo in alto a sinistra, anche in Processing.
Guardando la figura qui sotto, supponiamo che nell’elemento 8 dell’array bordo[] ci sia memorizzato il valore “1”. La posizione di questo punto nel piano è data dalle due coordinate (x, y), così ricavate: la x è il resto della divisione intera di 8 per 5 (la larghezza dell’immagine), quindi 3, mentre la y è data dalla parte intera della divisione di 8 per 5, quindi 1. Allora le coordinate sono (3, 1).

Siccome disegnamo le curve di Bezier nella sezione “draw()”, questo calcolo verrà ripetuto ciclicamente, dando la sensazione di un movimento di questa specie di pelliccia.
One of the most interesting features of Processing are the built-in functions for image processing.
First you must load the image in your project via the Sketch menu -> Add Files…, this creates a folder “data” in which the image is copied to be used.
At this point we identify the edge of the subject. The piece of code that interests us is the following (to be included in the block “draw ()”):
b = loadImage("DSC05842.JPG");
image(b, 0, 0, width, height);
filter(THRESHOLD, 0.4);
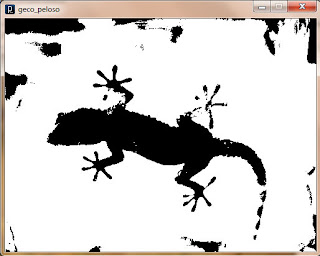
We apply a filter to the image, through a call, “filter (THRESHOLD, 0.4), to the filter function, with the first parameter set to” Threshold “, which identifies precisely the contours of objects in the picture, turning the image into black and white. Playing a little with the second parameter (ranging from 0 to 1, default 0.5) we can improve the yield for our photography. The result is this:
loadPixels();
for (int i = 0; i < width * height - 1; i++) {
if (pixels[i] != pixels[i + 1]){
bordo[i] = 1;
}else{
bordo[i] = 0;
}
}
updatePixels();

We have used the threshold function, so the values in the array will be only two: one for the white and one for the black.
Now we want to simplify the array in order to have the “1” along the edges and “0” in all other points. To do this, we scan the array Pixels[] through a “for” loop, and when we find two different values for two consecutive pixels, which indicates the presence of the edge, we store in the corresponding array bordo[] the value “1”. While in the other case, when the two values are equal, store “0”. We close this block with updatePixels(), recommended but not necessary.
c = loadImage("DSC05842.JPG");
image(c, 0, 0, width, height);
loadPixels();
for (int i = 0; i < width * height - 1; i++) {
if (bordo[i] == 1){
x = i%width;
y = i/width;
stroke(pixels[i]);
beginShape();
vertex(x, y); // first point
bezierVertex( x + random(25), y + random(25), x + random(25), y + random(25), x + random(25), y + random(25));
endShape();
}
}
Now we know where are the edges but we do not have values for the colors of these edges, because we used the “filter (THRESHOLD, 0.4).
So we load again the same image a second time. Now we scan in the same time arraies bordo[] and Pixels[] by a “for” loop. When we’re on the edge, we color the corresponding pixel, and we draw a curve through the “bezierVertex”, assigning random values to the parameters it requires, in order to draw small curves. Of course you can play with these parameters to change the resulting effect.
The starting point of the curve is along the edge and we will derive its coordinates, ie we have to apply the opposite function of the picture above.
As usual, the origin point of the plan (0, 0) is located in the upper left corner of the image, even in Processing.
Looking at the figure below, suppose that in the element 8 of the array bordo[] is stored the value “1”. The location of this point in the plane is given by two coordinates (x, y), so obtained: x is the remainder of the integer division of 8 by 5 (the width of the image), then 3, and y is given by the integer part of the integer division of 8 by 5, then 1. So the coordinates are (3, 1).

As we draw Bezier curves in the “draw()” section, this calculation will be repeated periodically, giving the feeling of a movement of this kind of fur.


Lascia un commento